There are many features and tools within Google Analytic that is under-utilize, one of these hidden gem we want to talk about today is the Pivot Table feature. Although this feature is useful on couple of different reports within Google Analytic, we found it to be the most useful for the Queries report within the Search Engine Optimization section. We will show you how to setup and use the pivot table for the Queries SEO report in Google Analytics.
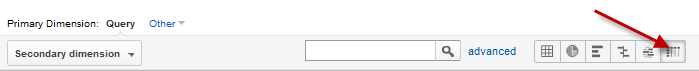
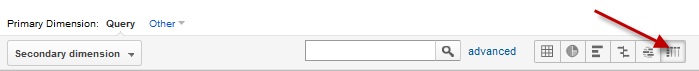
First, where is the pivot table feature? It is the last button on the tool bar below the graph.
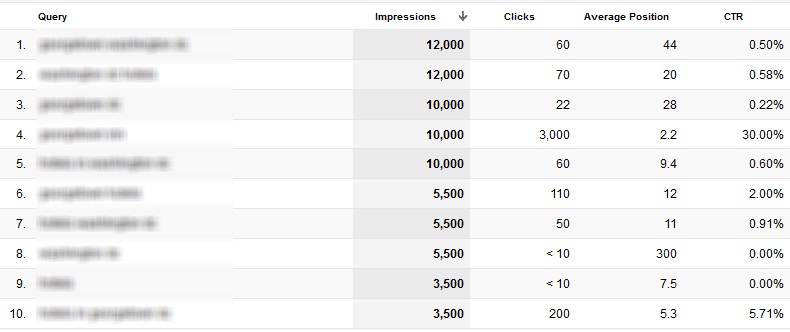
After clicking on it, you will notice your report gets a couple extra columns. How does this help you exactly? Let me first show you how the standard Queries report looks like.
This is a pretty good overview of what query is getting good impression, clicks, and average position. But the impression, clicks, and average position is calculated by combining all of the Google Properties (web, image, mobile, and video). This vanilla report does not show me how my SEO effort is helping or hurting my website’s performance in relation to each of the Google Properties.
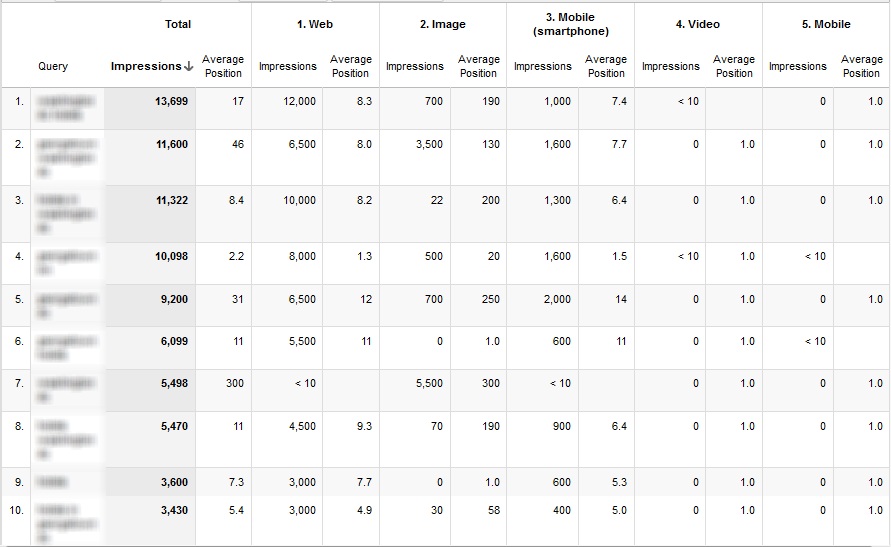
With the Pivot Table feature, we can organize the report into something like this.
This pivot table shows the impression and average ranking for the queries across all the Google Properties. (Web Search, Image Search, Mobile Search, and Video Search)
And this pivot table shows the impression and clicks for the queries across all the Google Properties. (Web Search, Image Search, Mobile Search, and Video Search)
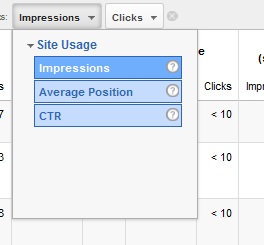
To setup the Pivot Table –
This is extremely useful for cross channel optimization strategies and cross channel focused marketers. We can quickly access what channel / keywords is doing well and which one needs more effort, we can also pull this report by month and track the changes over time. Looking at the example we can see that we have no present in the video search, so putting together videos campaign and optimizing a Youtube channels could be a strategies we focus on for the next quarter!
______________________________
Contributed by Chad Tsang, Sr. eStrategist
In the webinar, Milestone President Benu Aggarwal and VP of Marketing Erik Newton shared their thoughts on the…
2021 was a great year for Milestone as we innovated through the challenges of a…
Amstar DMC provides world-class destination services and guided tours to individuals, travel agencies, tour operators,…
HSMAI has recognized the compassion and achievement of the 1440 team with a 2021 HSMAI…
Recent trends in social media usage have evolved more than ever and it is evident…
While competing in the local market, covering all possible touch points to engage with customers…