Google Adwords Quality Score
It’s known that quality scores are the primary measure of a keyword’s relevancy and an indicator of future performance. As such, we have gone into great detail as to how quality scores reflect Adwords’ PPC algorithm and even selected it as a featured topic in our webinar on the Top PPC Trends of 2012. As such, whenever Google changes or reveals more information about quality scores – those occurrences typically create quite a stir for advertisers. One such change occurred in the last couple of weeks when Google announced a change to their status hover button in Adwords.
Quality Score Indicators – The Changes:
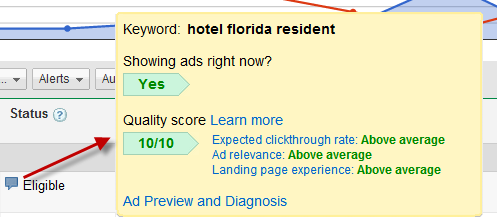
While the change doesn’t reveal the quality scores of competitor keywords, the three new indicators do give some insight into relative quality score compared with the “average”. The three new indicators are:
As can be expected, Google’s indicators remain somewhat vague – not providing tangible data to analyze; however, that doesn’t mean the information isn’t useful.
Each indicator is comparative to competition, with statuses listed as “below average”, “average”, or “above average”, which is a major improvement over the previous, slightly less helpful statuses of “poor”, “no problems” or “above average”. While this won’t help in every situation, it will provide some assurance for those keywords where the quality score might be low but each of the indicators show “above average” – meaning that while the keyword may not be that relevant, it is outperforming competitors in the industry.
For those currently running campaigns – have you found the indicators helpful? Have they impacted your campaign maintenance process? If so, let us know what you think!
_________________________________
Contributed by Jonas Pauliukonis, Sr. eStrategist
In the webinar, Milestone President Benu Aggarwal and VP of Marketing Erik Newton shared their thoughts on the…
2021 was a great year for Milestone as we innovated through the challenges of a…
Amstar DMC provides world-class destination services and guided tours to individuals, travel agencies, tour operators,…
HSMAI has recognized the compassion and achievement of the 1440 team with a 2021 HSMAI…
Recent trends in social media usage have evolved more than ever and it is evident…
While competing in the local market, covering all possible touch points to engage with customers…